4 timeframes
Compare short- and long-term structures for the same symbol in one popup.
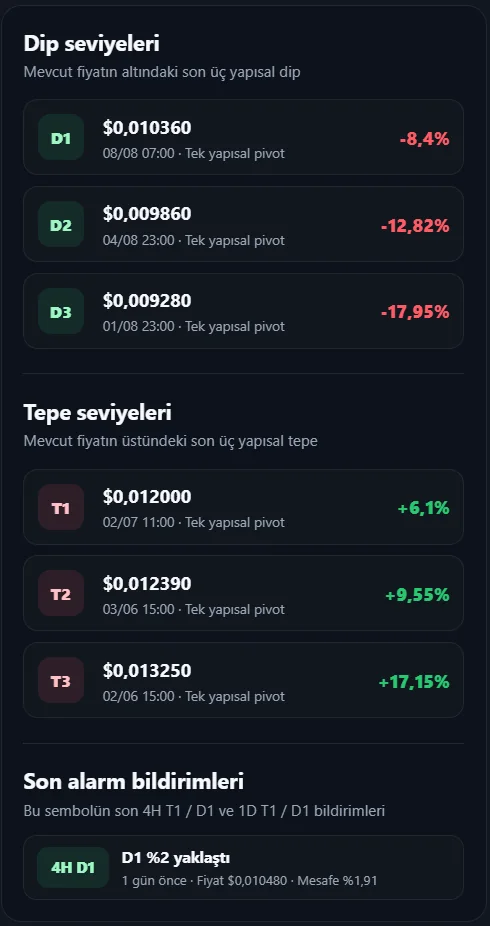
Review a symbol selected from scans or notifications across 4H / 1D / 1W / 1M. The nearest active levels are shown as S1 (Support 1) and R1 (Resistance 1).
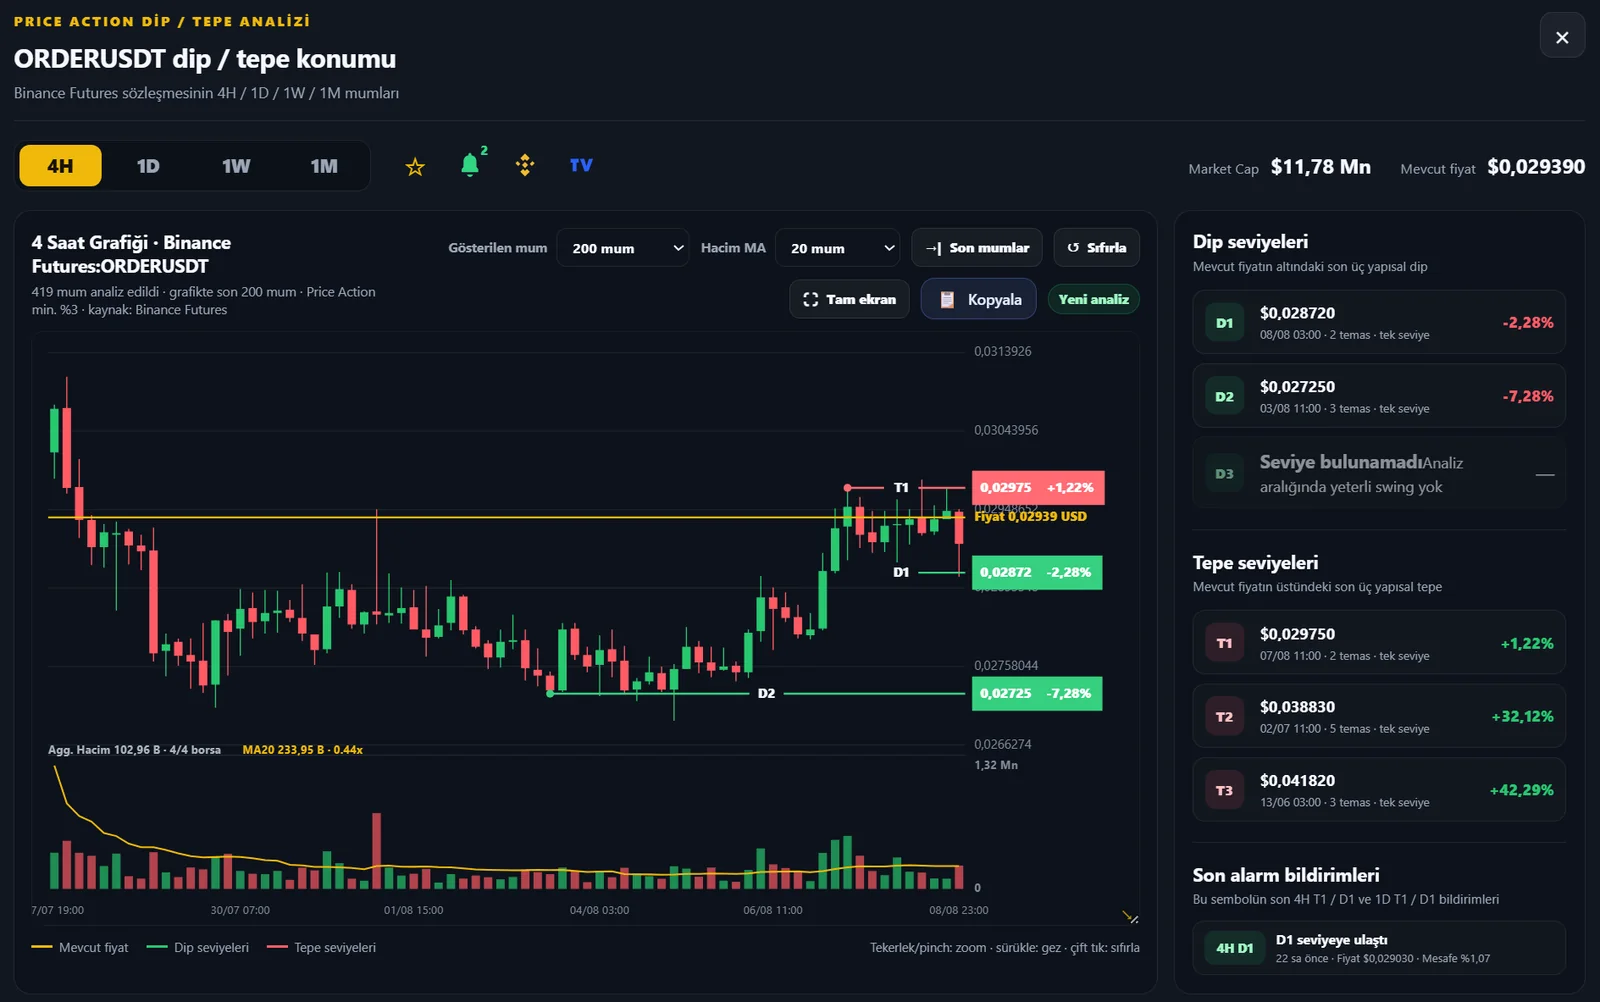
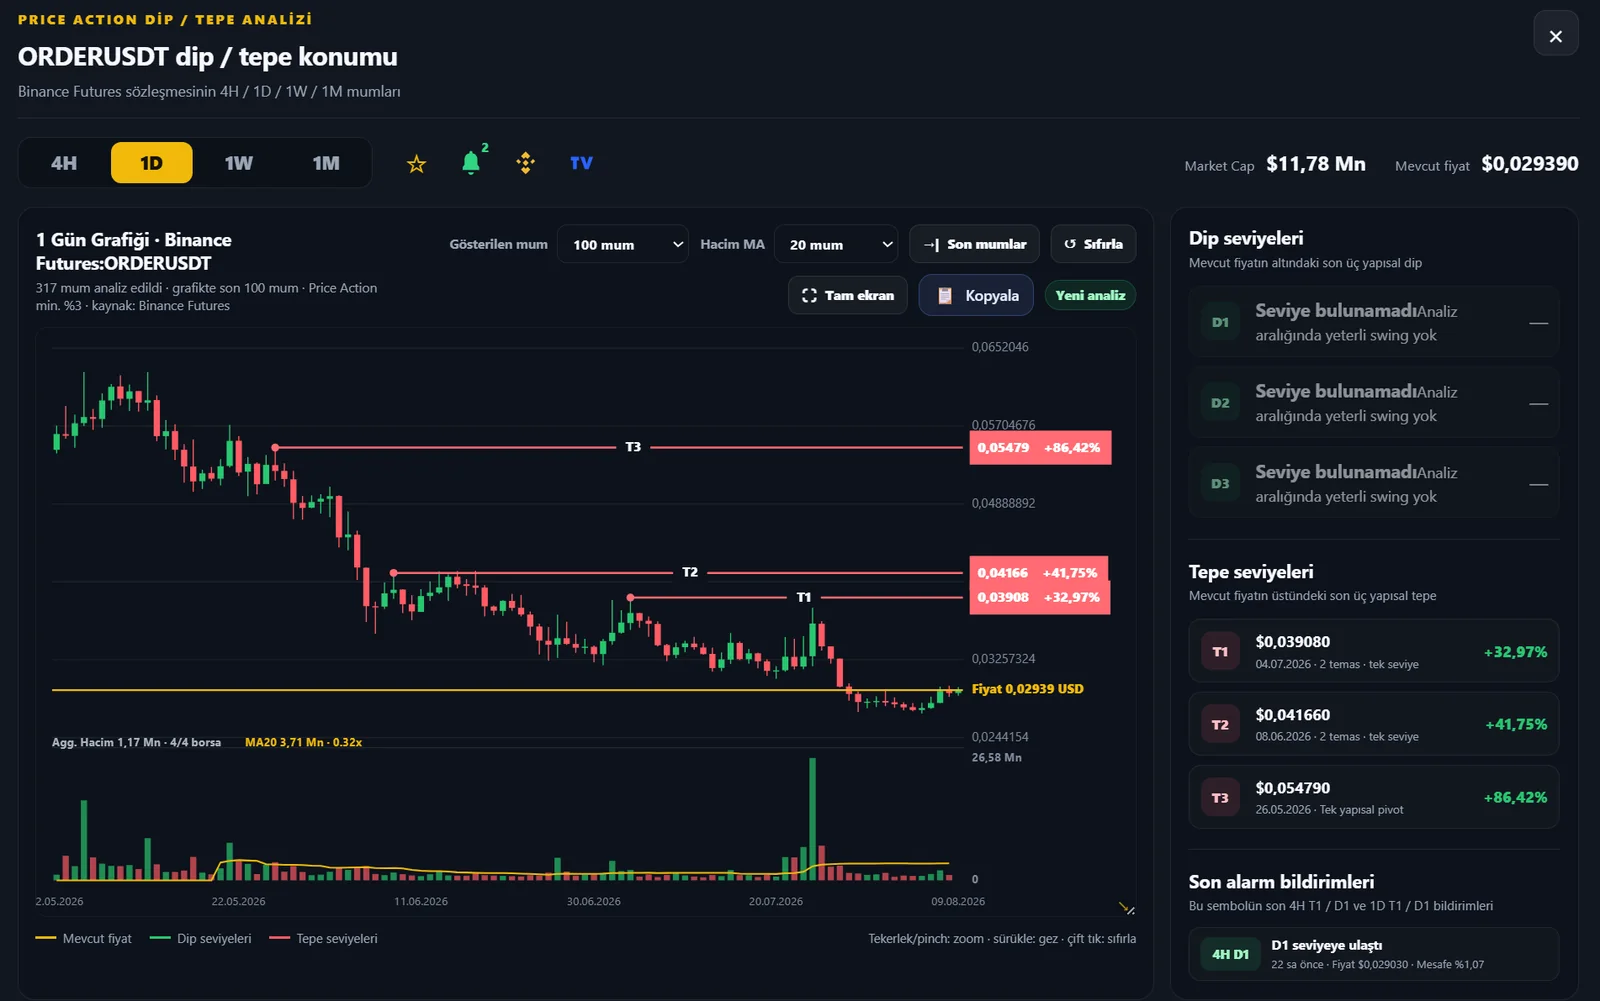
Compare short- and long-term structures for the same symbol in one popup.
Read volume bars and adjustable volume average together with price.
See distance from current price to active support and resistance.
See recent alert and notification context with the chart.
Inspect charts in a larger view on mobile or desktop.
Copy the chart/detail view for notes or sharing.