Technical monitoring for Binance USDⓈ-M Futures
Scan the market. Track quiet periods, extreme moves and possible reversals in one place.
Filter hundreds of Futures symbols and track 4H consolidations, long-term extreme moves, liquidity regions and S1/R1 levels with user-specific alerts and notifications.
15-minute market scan
4H consolidation analysis
S1 / R1 alert tracking
Push + email notifications
Modules
One platform from daily monitoring to long-term analysis
Each module filters the same Futures universe from a different angle; favorites, charts and notifications work across modules.
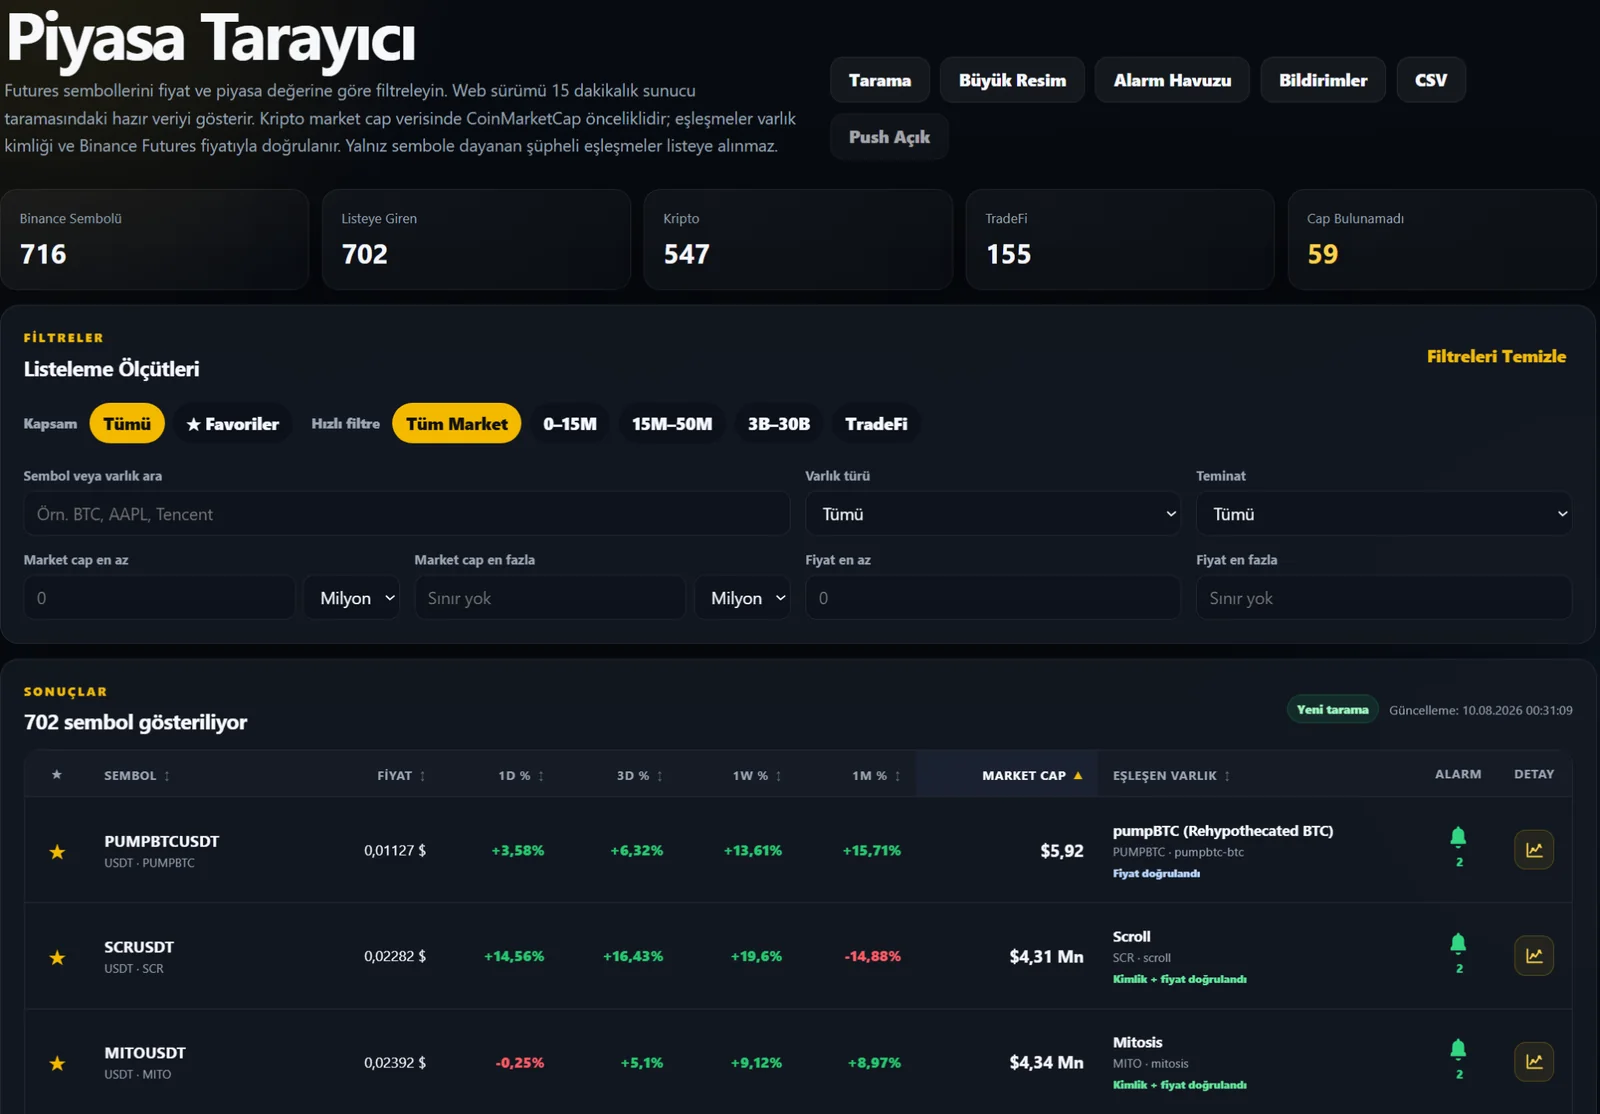
⌕ Market Scan
Price, market cap, performance and asset-type filters with Watch / Important / VIP favorite priorities.
View details →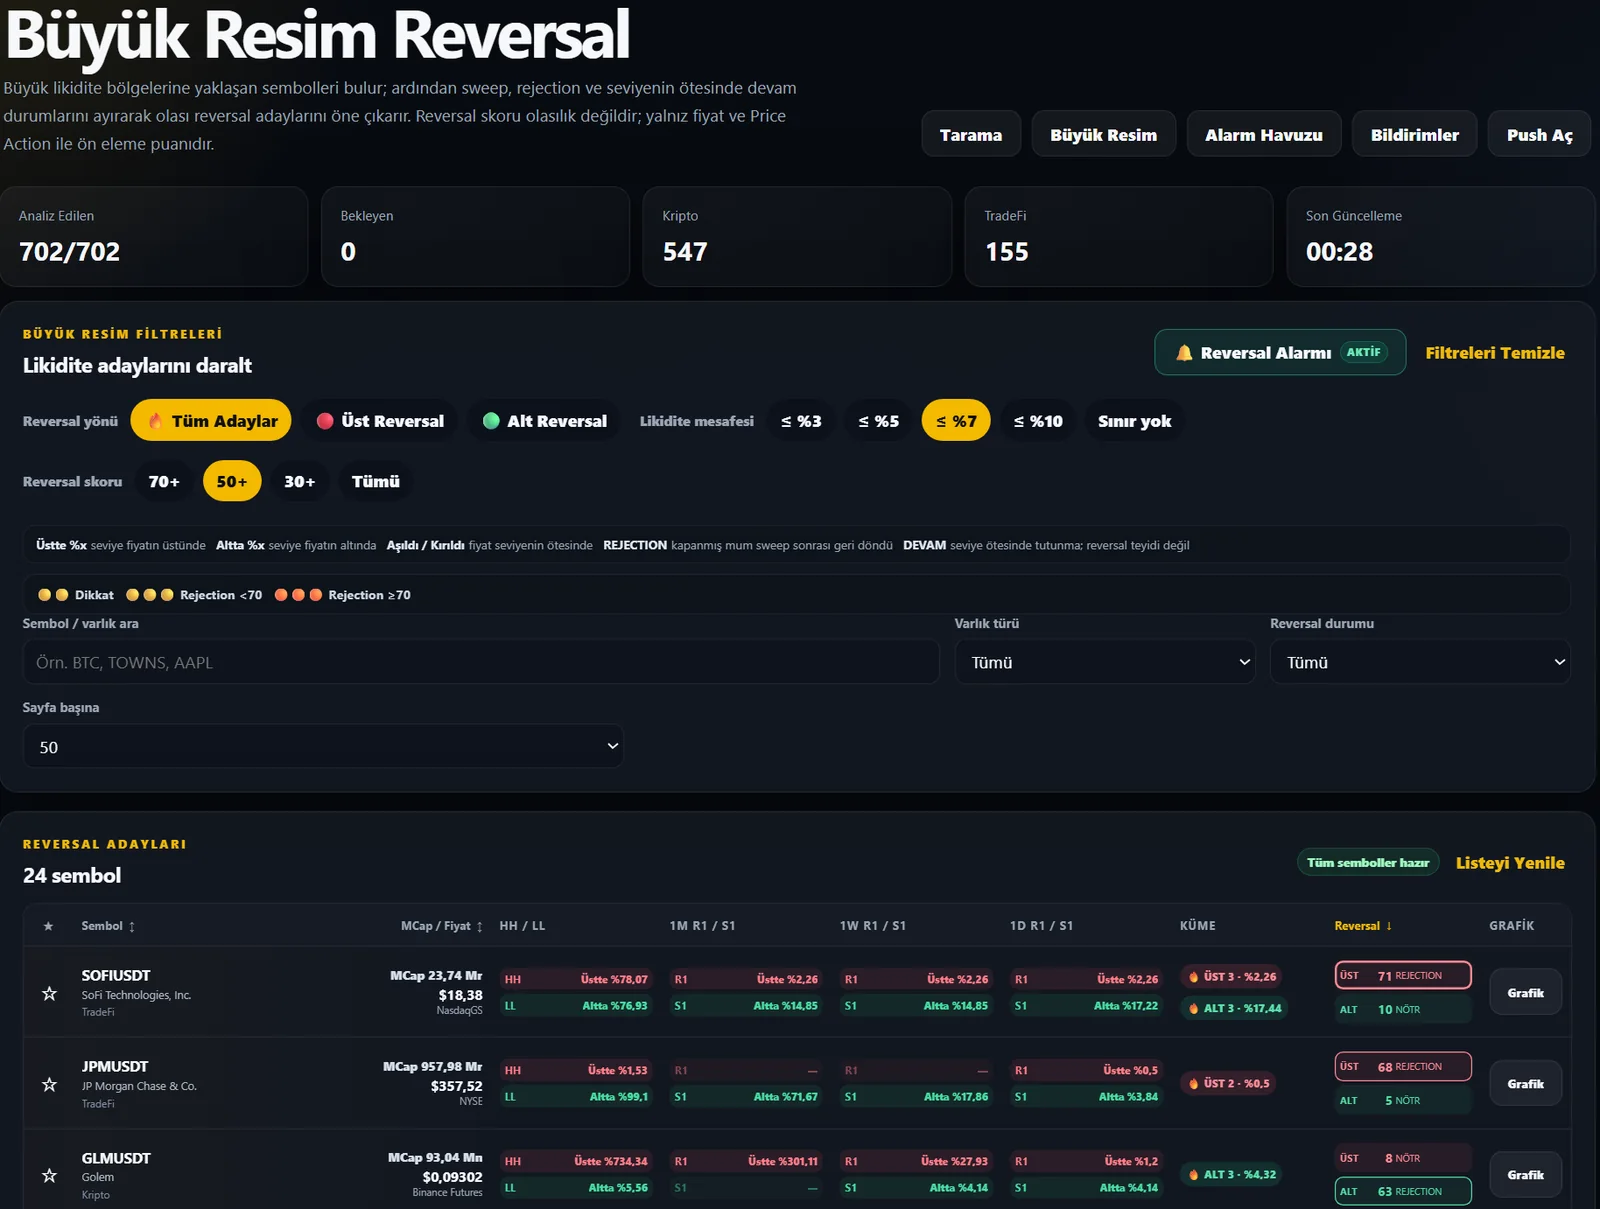
↺ Possible Reversals
Prioritizes symbols near major liquidity regions using sweep, rejection, continuation and scoring logic.
View details →Extreme Moves
Analyzes primary move, counter move, retraced and remaining range across 1M–6M periods with a single-record logic.
View details →4H Consolidation
Finds “calm before the storm” candidates using narrow range, ATR contraction, volume contraction and directionlessness.
View details →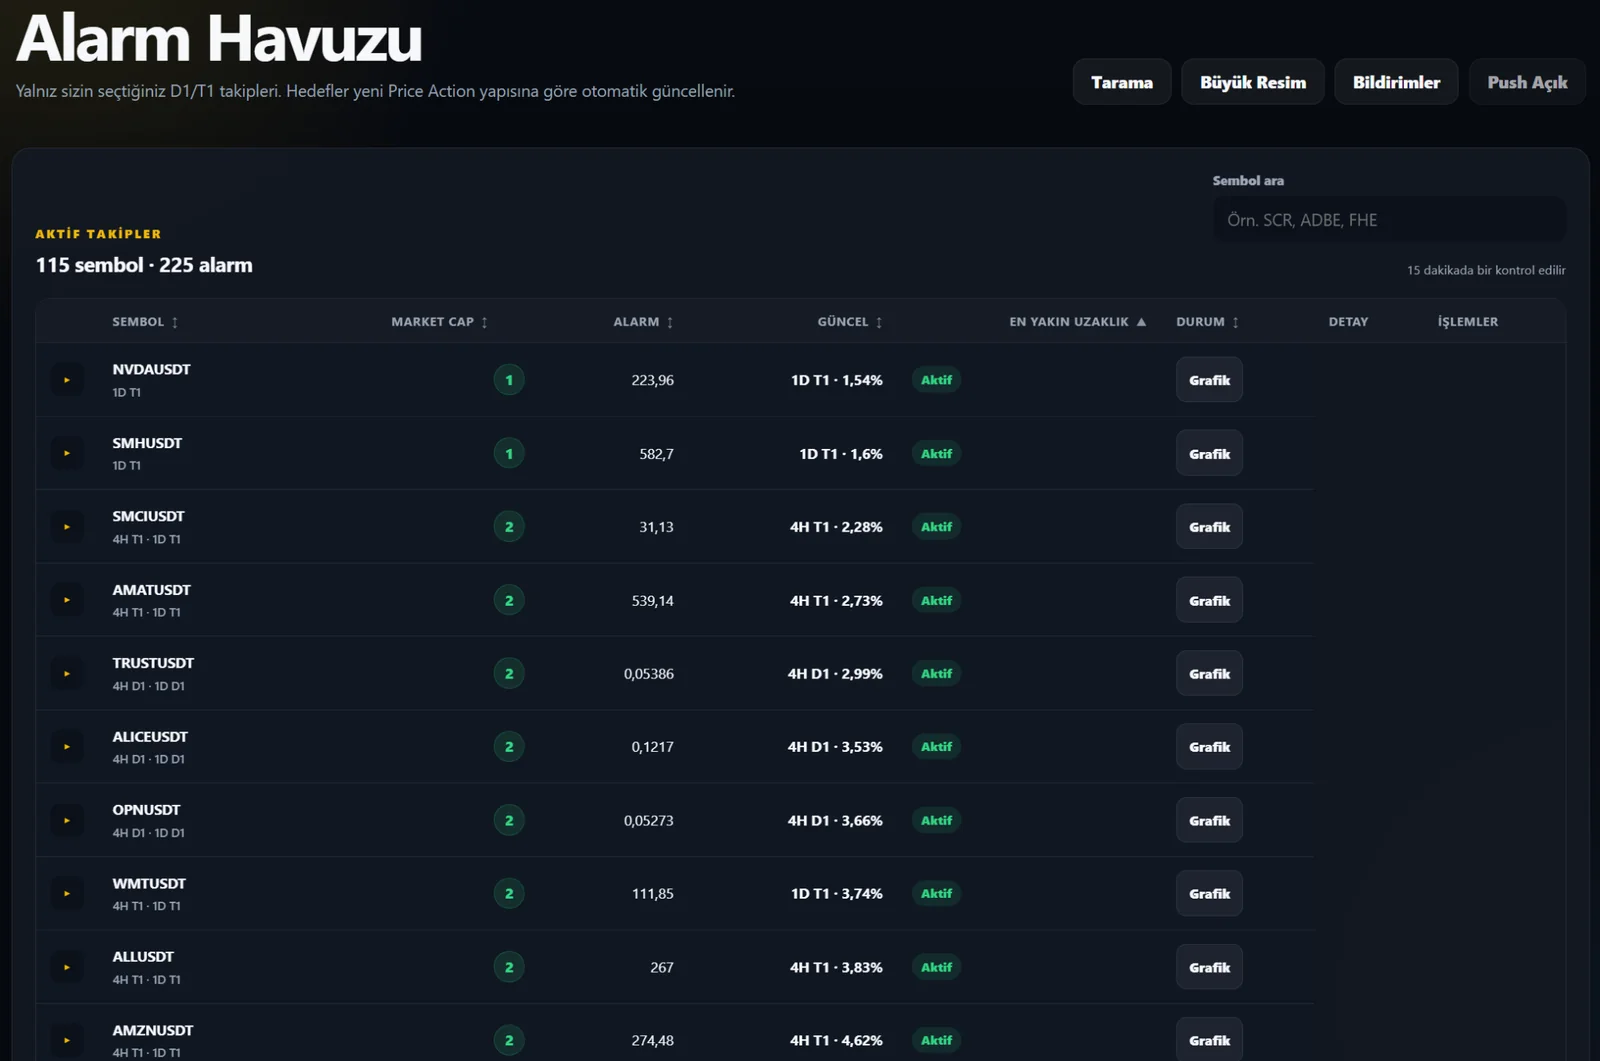
♟ My Alerts
Tracks 4H and 1D S1/R1 levels per user, including approach, touch and level rollover.
View details →Daily Sudden Move Alert
Tracks 1D movement from the daily open with user thresholds, a 20% absolute minimum and a 5-point repeat rule.
View details →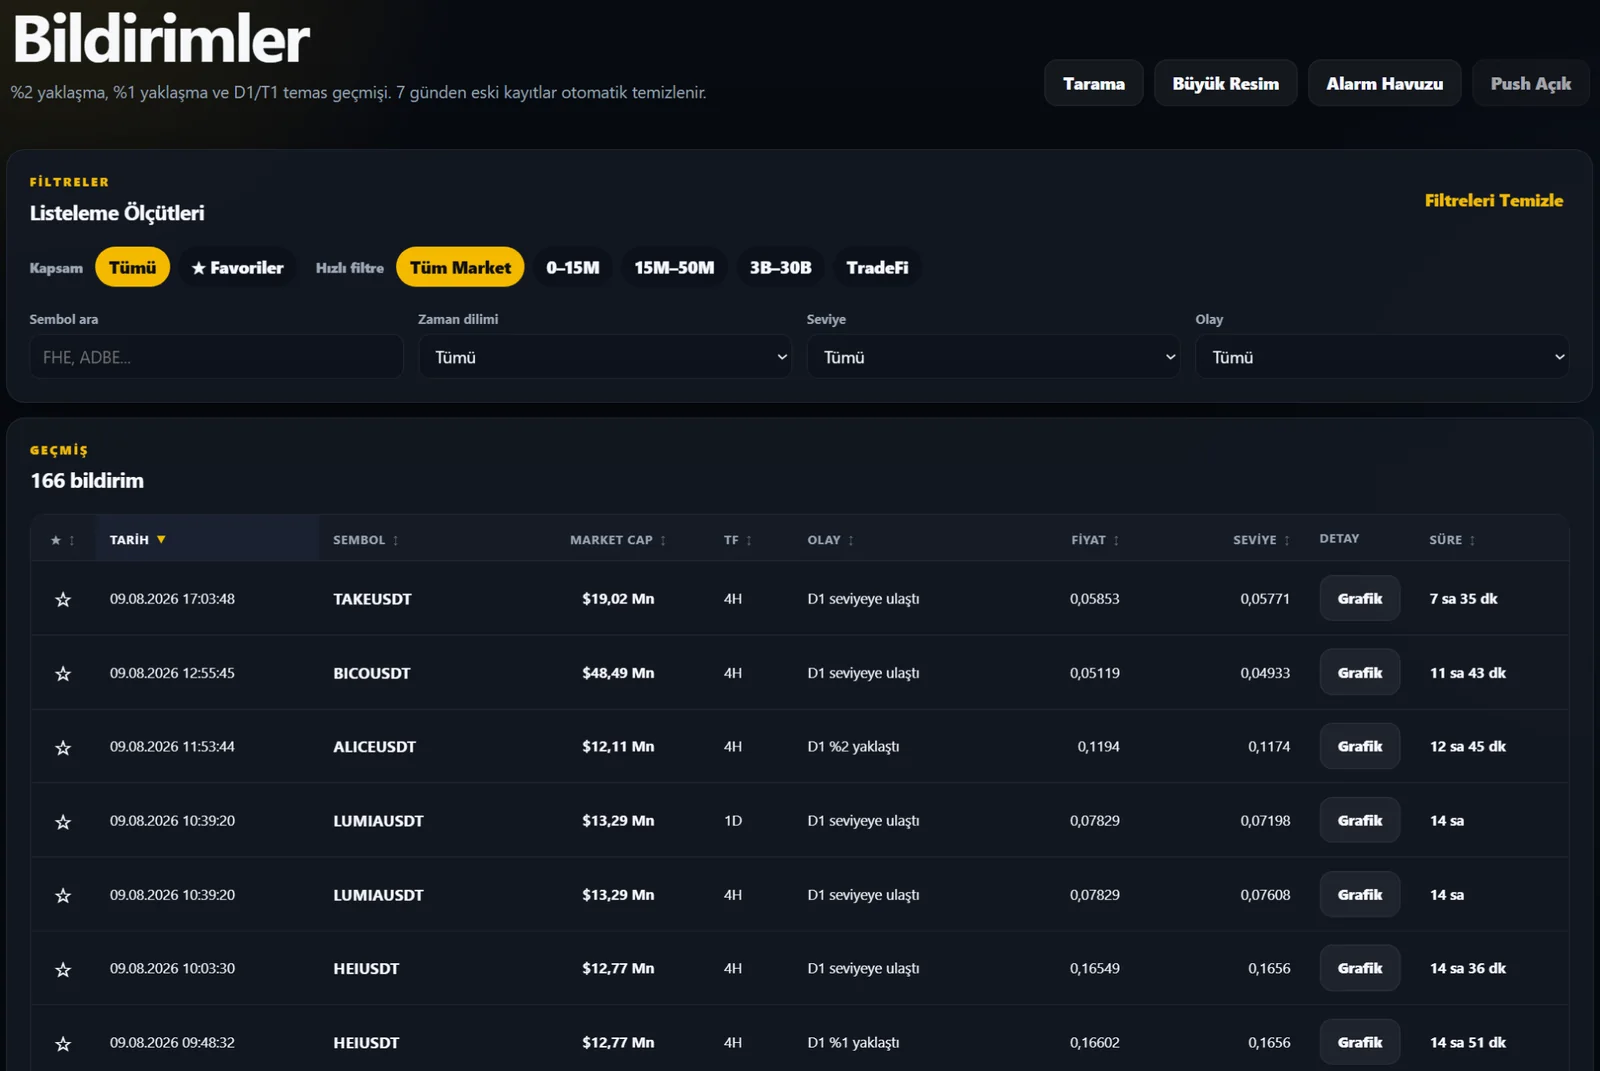
▤ My Notifications
Collects technical events in one history; notifications remain visible for 14 days even if push or email is missed.
View details →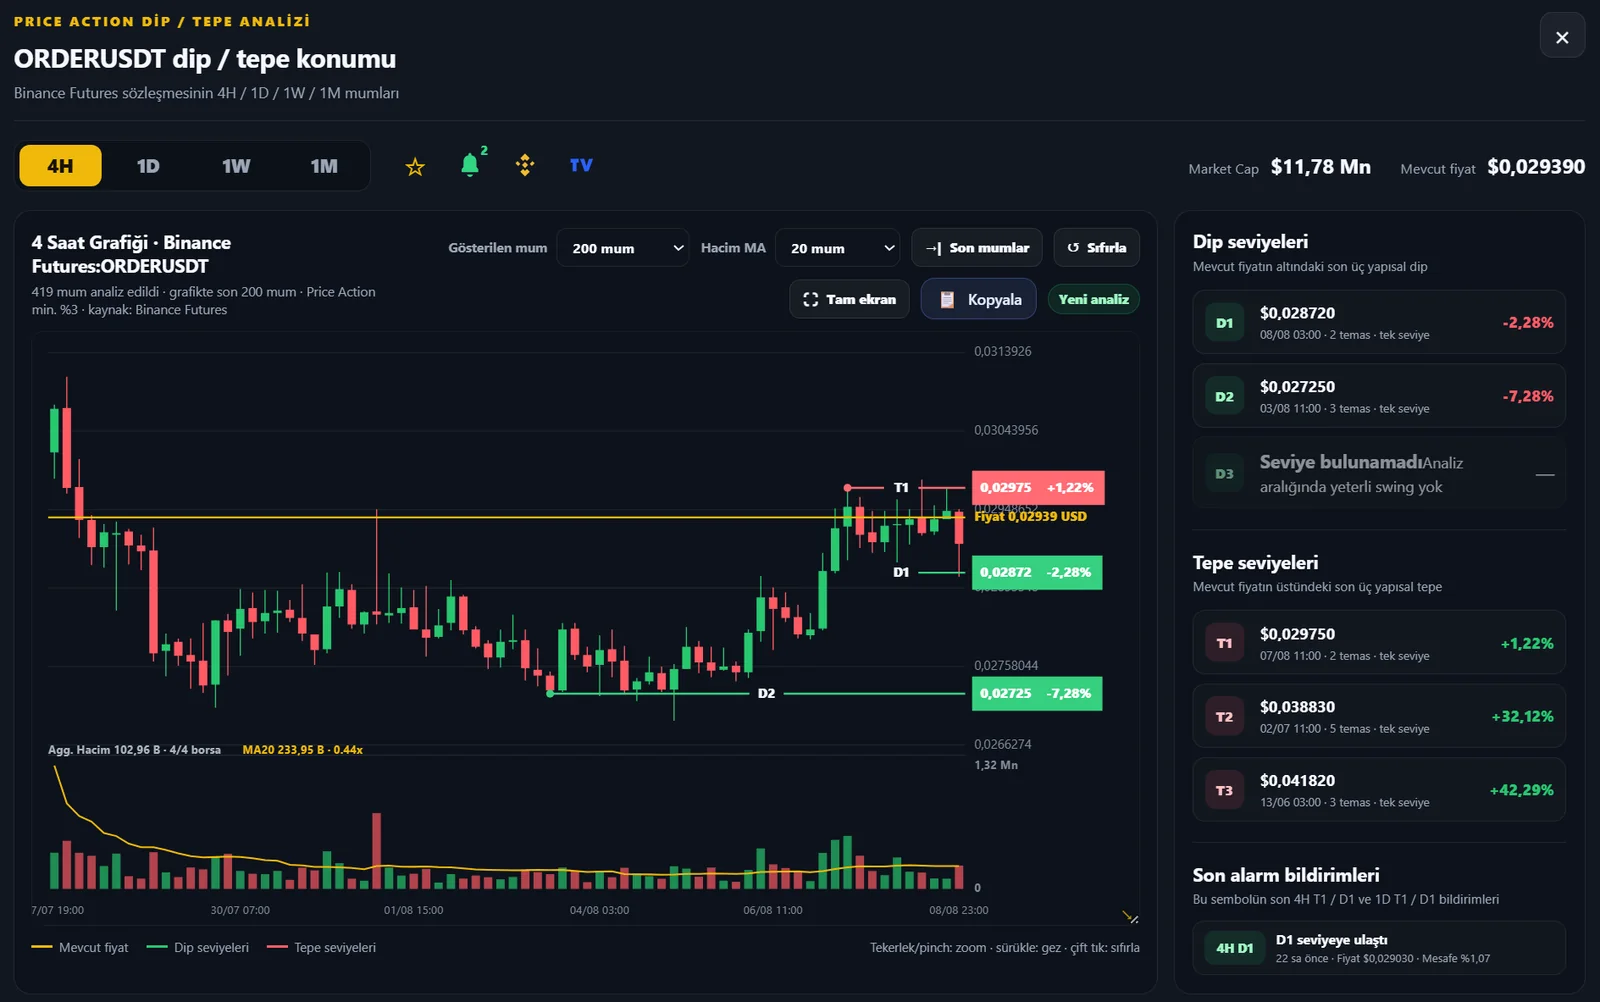
▥ Chart Analysis
4H / 1D / 1W / 1M views, S1/R1 levels, volume analysis, alert history and copy tools.
View details →Daily workflow
Scan → prioritize → monitor → alert → verify on chart
Narrow the market
Reduce candidates using market cap, price, change and module-specific filters.
Set favorite priority
Classify your watchlist as Yellow Watch, Green Important and Red VIP.
Check specialty modules
Find different market behaviors through Possible Reversals, Extreme Moves and 4H Consolidation.
Enable alerts and notifications
Set S1/R1 or daily sudden-move thresholds and use push/email delivery.
Review on chart
Review price structure, volume, S1/R1 levels and recent events together.
4H Consolidation Scanner
Combines duration, robust range, ATR, volume and directionlessness to surface symbols that have been “sleeping” for an extended period.
- 12–60+ bar minimum duration
- Low / Mid / High location
- 0–100 consolidation score + short interpretation
Split your watchlist into three priority levels
Mark the same symbol as Yellow Watch, Green Important or Red VIP without creating duplicate records, and see that priority across modules.
- 🟡 Watch
- 🟢 Important
- 🔴 VIP
Daily Sudden Move Alert
Uses the normal 15-minute scan without creating a second market scan. Default +30% / -30% thresholds can be customized by the user.
- 20% absolute minimum
- 5 percentage-point progression for repeats
- Push + email + 14-day history
🔐
2FAAuthenticator and policy-based account security.
▣
Device / SessionView active devices and control sessions.
🔔
Notification ChannelsWeb Push, email and centralized notification history.
◫
MembershipTrial, membership status and crypto payment reporting.